Simplifying Risk Adjustment
Syed Muzayan Mehmud
September 2024
Syed is a Principal with Wakely Consulting Group, an HMA Company. All opinions expressed in this article are solely those of the author and do not necessarily reflect those of his colleagues or employer.
LinkedIn: https://www.linkedin.com/in/smehmud/
1. Abstract / Overview
Healthcare risk adjustment methodologies have become increasingly complex, largely due to the belief that complexity enhances accuracy. However, a disconnect exists between how healthcare risk is assessed and how payments are adjusted.
This article explores the stark difference between measuring the accuracy of a risk assessment model at a member level, and that of a risk adjustment mechanism at the health plan level. I show that a highly simplified approach that does not use diagnosis codes can have similar accuracy on risk adjusted payments to models that do. These findings suggest that accuracy is not a barrier to developing simpler risk adjustment methodologies, which can improve payment accuracy and reduce the financial incentive for coding diagnoses.
2. The Disconnect
Accurate risk adjustment is crucial for ensuring health plans receive appropriate compensation for the risks they manage, discouraging risk selection and fostering market stability. Risk adjusted payments are critical for health plan financials and a significant portion of the premium they collect.
While model accuracy is not the only criterion in the development of a risk adjustment methodology, it is an important one that has guided the evolution of these models towards more complexity. We have added more condition categories, hierarchies within conditions, Diagnosis Codes (Dx), National Drug Codes (NDC), different sets of model coefficients for population subgroups, condition interactions, and so on.
However, more complexity comes at a significant cost. There is the cost to administer the program and a cost borne by health plans and providers with limited capacity to analyze and keep up with an elaborate method. There is also a large cost to society in the form of large potential overpayments due to differential diagnosis-coding, and large health plan investments into finding more codes that get passed to the consumer in the form of higher premiums. In the Medicare Advantage (MA) program alone, overpayments due to over-coding are estimated to cost taxpayers billions of dollars. [Link 1], [Link 2], [Link3]
Has a perceived increase in the accuracy of risk adjusted payments been worth the complexity and added costs to society?
Healthcare risk adjustment accuracy is typically measured using member-level measures such as r-square, or predictive ratios for subgroups such as demographic cohorts or disease conditions.
However, there is a glaring disconnect in how we measure accuracy and how risk adjustment really works. We don't transfer payments between members of health plans or cut checks to demographic cohorts or those for specific diseases. Risk adjustment takes place at the level of health plans. These plans typically have thousands of members, with varying mix of demographics, disease conditions and so-on. The measurement of payment accuracy should not rely on member-level metrics or predictive ratios for selected subgroups, but rather on calculating the difference between predicted risk for a health plan and the actual risk incurred.
3. A Better Way
Once we look at accuracy in terms of how entities get risk adjusted instead of how members get risk scored, we find that far simpler models approach the accuracy of more complex ones.
Before I show with real data how this can work, let's spend a little time thinking through how this can ever work. It may seem counterintuitive that a less accurate model at the member level can perform just as well at the health plan level, where risk adjustment payments are actually made.
The key to understanding this is that error dynamics are different when we are thinking of total variability within a population vs. the variability within non-random groups of members. If risk adjustment models were perfect (i.e., r-square of 1.0), then their predictions would be perfect regardless of whether we measure them at the member or the group level. But these models are not perfect. The best ones have large magnitudes of errors, with r-squares well below 0.5. This leaves the door open to unexpected results when we roll up predictions and associated errors from a member to a group level.
A simple example is worth a few paragraphs. So, consider the following illustration, that also foreshadows how we will analyze real data.
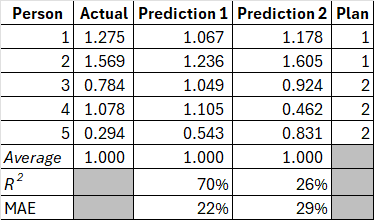
Exhibit 1 shows data on five hypothetical individuals. Their annual expenditure is in the Actual column. These expenditures are not in dollar terms but are scaled so that they average to 1.0 over the population. There are predictions for the risk of these members from two different models, Prediction 1 (P1) and Prediction 2 (P2). How do we tell which model predicts expenditures better?
Exhibit 1: Member-level data
Source: author's analysis.
We can calculate measures such as the coefficient of determination (R²) and Mean Absolute Error (MAE). In this example, P1 has an R² of 70% and P2 has an R² of a distant 26% by comparison. Further, the MAE for P1 is significantly better (22%) relative to P2 (29%). MAE is a better measure for risk adjustment payment accuracy as it is the difference between what was expected and what happened. By either measure, clearly, prediction 1 is the better model.
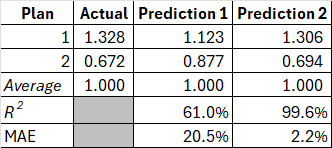
Or is it? Two of our hypothetical individuals belong to plan 1, and three to plan 2. This is indicated in the Plan column. Recall that we don't make risk adjustment payments to individuals; we make these to health plans. We need to roll up this data at the plan level[^1] and re-calculate our performance metrics. Once we do this, we get the table in Exhibit 2, and the tables have turned! P1 has an R² of 66% on a group basis, whereas P2 has a staggering R² of over 99%! Further, the MAE for P1 is now higher at 21% relative to P2 at just 2%.
Exhibit 2: Plan-level data
Source: author's analysis.
In this illustration, it would be a mistake to pick a P1 over P2 as the better model. On the metric that ultimately matters, payment accuracy to risk adjusted entities -- this is a no contest. We risk making a similar mistake within large scale healthcare risk adjustment programs if we don't align the measurement of risk adjustment accuracy with how these payments get made.
3.1 Testing with data
To keep with the earlier illustration, I have actual healthcare costs that are scaled to 1.0 over more than ninety-thousand real-world observations from Agency for Healthcare Research & Quality's (AHRQ) Medical Expenditure Panel Survey (MEPS). The data is for years 2017-2019, including households with Medicare, Medicaid, and Commercial coverage.
Representing the status-quo method, I have risk scores from Centers for Medicaid & Medicare (CMS) Hierarchical Condition Category (HCC) model -- the same model that is used to adjust payments plans in the Affordable Care Act (ACA) program. This model uses demographic information such as age, gender, diagnosis codes as well as prescription drug codes. Thousands of diagnosis codes and NDCs are organized into more than 150 HCC indicators, including hierarchies, condition interactions, pharmacy flags and so on.
For my alternative approach, I use a simple method based on age, gender, and just twelve health status survey questions. The questions are along the lines of what most of us experience when filling out paperwork in a doctor's office. These include "have you been diagnosed with cancer?", "do you have diabetes?", and "do you have difficulty walking up a flight of stairs?" etc.
An approach that utilizes detailed diagnosis-codes will be most accurate in a concurrent application. I chose this comparison to give my alternative approach its stiffest test.
The member-level performance from the two models is presented in Exhibit 3.
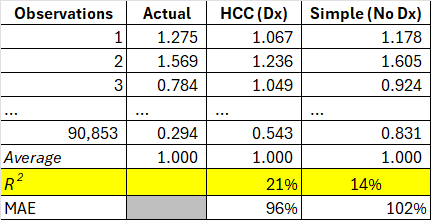
Exhibit 3: Member-level comparison of HCC (Dx) and Simple (No Dx) predictions
Source: author's analysis.
As expected, the highly complex diagnosis-based HCC risk adjustment model performs well, with an R² of over 20%. The R² of my simple model isn't too far behind at 14%. I note that the performance of the diagnosis-based HCC model used in the Medicare Advantage (MA) program is around 11%.
Next, I assemble hypothetical health plans from the data, that look just like real health plan entities, with typical group sizes as well as a typical distribution of expenditures that is observed for real-world health plans. Then, I recalculate our metrics just like we saw in the illustration above.
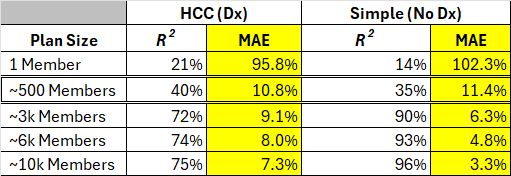
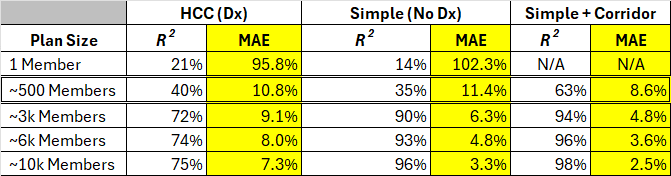
Exhibit 4 shows the R² and MAE results for the two very different approaches by plan size. The diagnosis (and Rx)-code based HCC model, and the ultra-simple model that relies only on demographics and a few questions about a member's health status.
Exhibit 4: Plan-level comparison of HCC (Dx) and Simple (No Dx) predictions
Source: author's analysis.
We see the relatively lower performance of the simple model replicated for plan size of 1 (which is equivalent to the prior table for individuals). As soon as we started measuring payment accuracy between groups of people, the performance gap closes between the diagnosis-based and the simple model. In fact, the simple model tends to perform better.
This is a striking result. A simplistic model relying on twelve questions about health status outperforms a model relying on over 10,000 diagnosis codes and over 10,000 National Drug Codes (NDCs). There are two reasons for this, both of which accrue from a central point of this paper. One, we need to measure accuracy of models in a way that represents groups of members that are risk adjusted, and crucially, we need to build our models in that way. We get significantly better payment accuracy when we fit our models to groups of individuals representative of health plans rather than individual members.
I note that for group sizes around 500 members, the more complex diagnosis-code based model performs slightly better. More than 99% of the members in MA or ACA are in plans with higher membership, however, we still need to think about how to address improve payment accuracy for the tiny health plans, which are relatively few. One relatively simple way to accomplish this is through a two-sided risk corridor. In the following set of results, I implemented a 25% corridor, where a health plan is credited 25% of the difference between actual aggregate risk and that estimated by the model. Such an approach can be implemented below a very low threshold of plan size and is likely not necessary to do for larger plans that comprise almost the entire membership in the MA or ACA programs.
Exhibit 5: Same as exhibit 4, with an added set of results that combines Simple method with a risk corridor
Source: author's analysis.
4. Further Exploration
The way we measure accuracy of risk adjustment models informs policy and the direction of the development of risk adjustment models. We can do better at aligning the way we measure model performance to how these models work in practice.
This paper demonstrates that we need not chase complexity on the grounds of risk adjusted payment accuracy. There is an enormous potential for desirable outcomes if we can simplify risk adjustment methodologies. The specific option discussed in this paper is self-reported health status, with no reliance on healthcare claim data.
Towards the objectives of simplicity, mitigating gaming, and higher payment accuracy, there are several areas for further research and development:
-
Research into candidate localities for a pilot MA program. In this way we can run a parallel calculation and test the effectiveness of a health status survey compared to the current healthcare claim data and diagnosis-code based approach.
-
To address concerns around gaming of survey answers, such a survey should be centrally administered and controlled. This will go a long way towards leveling the playing field. We need research into how technology can be used to accomplish this efficiently. Further research should focus on identifying the most predictive and least manipulable survey questions, as well as developing robust mechanisms for centralized, unbiased survey administration.
-
We already have marketing regulations designed to prevent discriminatory practices including member selection based on health conditions. There can be further research into appropriate regulations that would prevent gaining an unfair advantage for health status survey completions (e.g., disallowing coaching, incentives, etc.).
-
Research into additional resources that could be deployed by the central administering authority to mitigate uneven survey responses where necessary (e.g. multi-lingual support, access to technology, educational programs, etc.).
-
Members have concerns about privacy. In the MA program detailed data is already centrally collected on members in an identifiable way. In the ACA program, detailed member-level data is collected centrally in the EDGE program but is somewhat de-identified. In this paper I am advocating for a group level approach, so central data collection could be completely de-identified, lessening privacy concerns in this approach vs. the reality today. We don't care about linking health status survey responses to an individual or even a member identifier; we just care about aggregating those responses up to the health plan level.
-
Along with measuring accuracy, the way we build and calibrate a risk adjustment model also depends greatly on whether we take a member-level or a group-level view. More research is needed on analyzing group-level risks with real world characteristics and for selecting variables and calibrating models on that basis.
-
Of course, model accuracy is not the only consideration in evaluating the success of a risk adjustment program. One consideration is the resources required to execute a given methodology. A far simpler risk adjustment approach will also be easier to administer. The efficiencies gained could unlock resources for researching other desirable features of risk adjustment policy, for example, using social determinants of health towards improving healthcare equities in vulnerable populations.
-
An important limitation of the data I used in this analysis is that all the information is self-reported. Participants in the MEPS survey were asked about each hospitalization, outpatient or doctors' visit. Professional coders then translated detailed survey responses from a medical visit into diagnosis codes and prescription drug codes. The general health status questions that I used in my alternate approach were mostly yes/no questions from a different part of the survey, and were representative of how this process might work in practice. As I noted above, there is evidence here that self-reported data can explain a large amount of variation in healthcare spending, perhaps even greater than what we currently observe in a program like MA. Still, we need to do a pilot study to assess the applicability and generalizability of the results presented in this paper.
5. Conclusion
The two main points in this paper are:
-
We need to align how we measure healthcare risk adjustment accuracy with how these adjustments are actually administered.
-
Once this alignment is achieved, a far simpler approach becomes feasible -- one that could not only improve payment accuracy but also eliminate the need for healthcare claim data.
The second point is important. Tens of billions of dollars move to or between health plans in each of the MA and ACA programs each year. As long as healthcare claim data drives risk adjustment, incentives will favor measuring differential data quality rather than the actual health status of members. This undermines the purpose of risk adjustment.
A simplified risk adjustment methodology has the potential to address these issues while improving payment accuracy, presenting a transformative opportunity. The proposed approach offers a practical path forward in improving the efficiency and fairness of healthcare payments, while unlocking vast resources that can be put to a far more productive use in healthcare rather than chasing codes.
To assess the feasibility and impact of this simplified methodology, a pilot program should be conducted alongside the existing approach. This would allow for real-world testing, refinement of the model, and provide insights into potential implementation challenges and solutions.
[^1]: This includes rescaling to 1.0 over the plan-level