The traditional flow of using analytics tools with data is already feeling dated.
It used to look something like this: you'd get data, load it into a data-focused tool (for example SQL...remember Access?), and then analyze it using something else like Excel or Power BI. If you were fancy, there was maybe an ETL tool in the middle and a cube at the end. The core pattern was the same: one set of tools existed to wrestle the data into a usable shape, and a separate set existed to actually think about it.
For a long time, most of the effort lived in that first category. Surveys of data professionals have been repeating some version of the same statistic for a decade: the majority of time is spent collecting, cleaning, and organizing data rather than analyzing it, often estimated around 60 to 80 percent of the job. Anyone who has spent an afternoon debugging a broken CSV import does not find this surprising.
Sacred scrolls
In the "old" workflow, the scripts that loaded regularly updated data were carefully written, meticulously reviewed, and handed down to new generations of analysts like sacred scrolls. A single query might have a lineage: v3_final.sql, v3_final_really.sql, v3_final_july_hotfix.sql. If someone changed a join, everybody got nervous.
These pipelines felt fragile because they were. A weekly refresh might involve:
- Pulling raw files from an SFTP server.
- Loading them into a database using a batch process.
- Running a collection of stored procedures to normalize and aggregate.
- Exporting the "clean" views to Excel or a reporting tool.
Each of those steps could fail in its own special way. Wrong file naming convention, encoding issues, a new column added in the source system, a data type change that quietly truncated values. The scripts contained all the tribal knowledge about how to survive those surprises.
So we treated them with appropriate reverence. Every small performance improvement was cause for a little celebration. Shaving ten minutes off an overnight job felt like winning back part of your life. There were real skills involved: understanding indexes, reading execution plans, predicting how badly a Cartesian join would go before you hit Run.
The downside was that the work we were nominally hired to do, the part with "analytics" in the title, often had to squeeze itself into whatever time was left over. If you wanted to ask a new question of the data, you first had to negotiate with the pipeline.
One tool, one conversation
Now, within the same tool, you can issue a fire-and-forget prompt that loads the data. You point it at a warehouse, a folder, or a bucket, and say something depressingly human like, "Bring this in, fix anything obviously broken, and let me know when it's ready."
You don't really care how many times it fails, because it can recover and finish the job while you go do something else. It notices performance issues and fixes them. It retries a load when an API coughs. It offers to adjust storage or partitioning when something looks unwieldy. And when it's done, you analyze the data in the same place.
Under the hood, of course, there are still queries, transformations, file formats, and all the things there used to be. The difference is that an LLM-shaped layer is starting to plan and write those on your behalf. There is a small but growing body of work on "data science agents" that orchestrate entire workflows: from data retrieval to cleaning to modeling and visualization, all by chaining tools and code behind a single conversational interface. Some experimental systems (like the one I'm building at VerbaGPT) already do end-to-end pipeline creation, tuning, and maintenance from a single high-level instruction.
You could look at that and say, "So we are just auto-generating more sacred scrolls." That is partly true. But the experience on the analyst's side is different enough that it changes the shape of the work.
Instead of asking "What is the SQL for this?" you ask "What question do I actually want answered?" The system then does its best to backfill the implementation details. You still need to check its work, but you no longer have to personally choreograph every step.
The collapse of time and tools
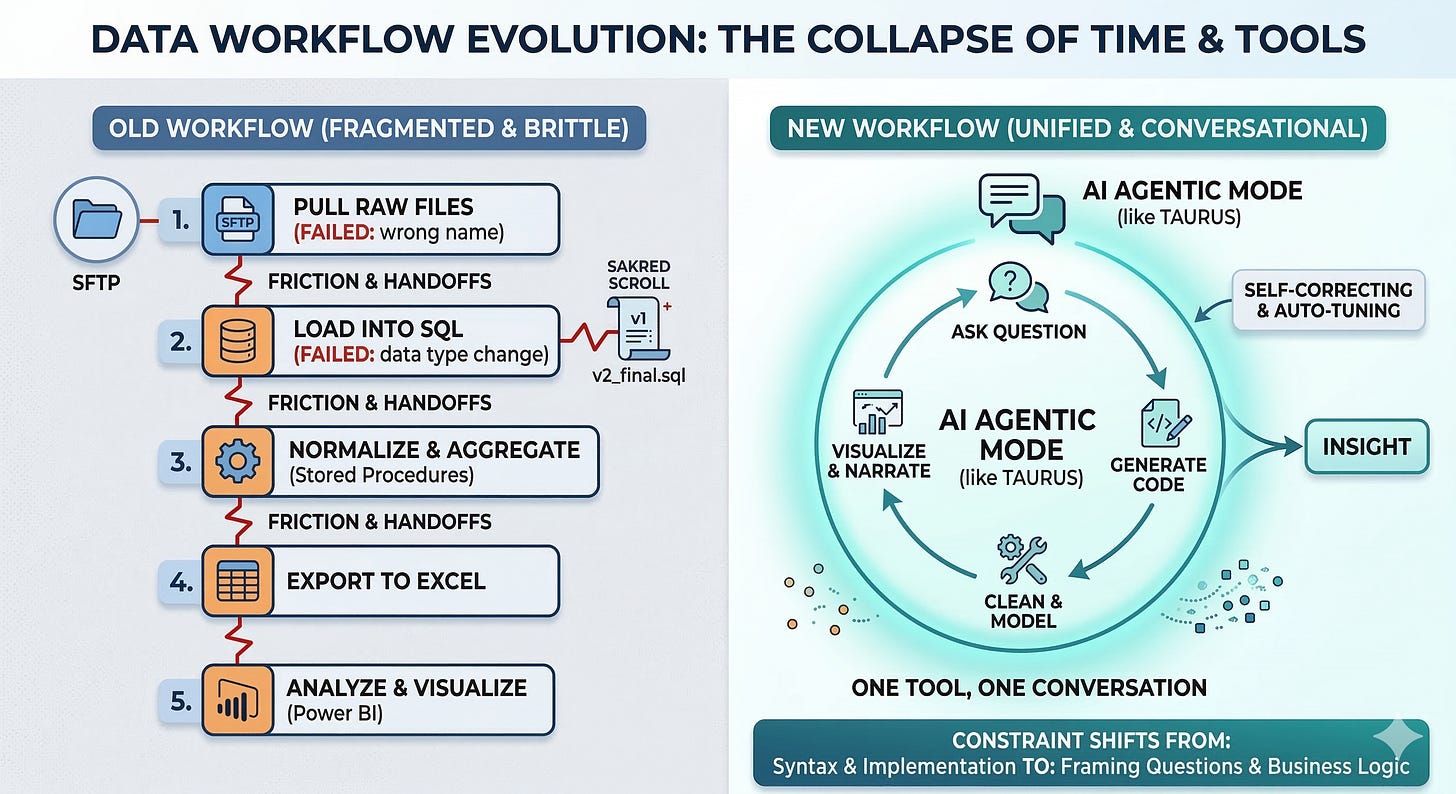
What's happening is a collapse of time and tools. The time once spent cajoling data and jumping between environments to load and analyze it is disappearing, or at least compressing itself into a background process.
Historically, you could draw a neat line between:
- Data work: pulling, cleaning, joining, reshaping.
- Analysis work: exploring, visualizing, modeling, interpreting.
They lived in different tools, often owned by different teams. The handoff was literal: here is your refreshed table; here is your updated extract; here is your cube for the week.
When that boundary softens, the cycle from "question" to "first answer" shrinks. You are no longer context-switching from database to ETL tool to notebook to BI dashboard. You are mostly staying in one place, having one ongoing conversation about the data, and letting the system handle more of the plumbing.
This matters for two reasons.
First, anything that reduces the friction of asking one more question tends to improve the quality of the work. If your mental cost for "What if we slice this by tenure instead of age?" drops from "open three tools and rewrite a join" to "type a follow-up sentence", you will ask more of those questions. A lot of insight is hidden behind the fourth or fifth iteration, not the first two.
Second, the skills that differentiate a strong analyst start to move away from memorizing the exact syntax for a window function and toward having a clear mental model of the business, the data, and the caveats. The constraint shifts from "Can I implement this?" to "Is this the right question and can I tell when the answer is wrong?"
We are not there universally yet. There are still plenty of brittle pipelines held together with stored procedures and sticky notes. But the direction of travel is clear, and the new tools are not politely waiting for us to redesign our job descriptions.
Show & tell: Analyzing SEC 13F data
Here's an example of what this looks like in practice.
In this case, the data is not a handful of CSVs on a shared drive, but a fairly large institutional dataset already sitting in Snowflake: a 13F holdings database with tens of millions of rows, quarter-over-quarter trails, and the usual mix of quirks you get in real regulatory data. The question I asked was simple in English and slightly evil in SQL:
"Analyze how fund managers have treated Microsoft over the last 4 quarters. Exclude passive fund managers."
Instead of designing a pipeline, I dropped that question into a chat interface running an agentic mode (Taurus mode on VerbaGPT platform). Behind that one prompt, it:
- Explored the Snowflake catalog, located the relevant 13F tables, and inferred how filings, managers, and positions linked together.
- Wrote and iterated on SQL to calculate flows in and out of Microsoft by manager, quarter, and fund size, excluding index and passive vehicles.
- Spun up Python to build a custom visualization of "biggest buyers" and "biggest sellers" as part of a one-off dashboard, debugging file paths and environment details along the way.
- Generated a narrative summary of what active managers had actually done with Microsoft over the last four quarters, complete with net flows, buy/sell ratios, and conviction shifts by fund size.
All of this happened inside one conversational thread. I did not manually write the SQL, manage the connection string, or open a separate notebook to produce the chart. My job was to read, correct where needed, and then think about whether the story it surfaced actually made sense.
The interesting part is not that the tool can read from Snowflake and run Python. A few other platforms can do that. It is that what used to feel like a multi-stage project (spec the question, build the data set, debug the joins, move to a notebook, build visuals, write a narrative) had quietly become one continuous interaction in a single window.
Prompts that write their own prompts
There is a small postscript to that example that underlines that this is a new world.
As Taurus worked through the 13F analysis, it maintained its own internal to-do list and refined its tools and code paths based on what broke. When a visualization failed to save where it expected, it did what any decent analyst would do: inspected the directory, adjusted the path, retried, and only then moved on.
The same pattern applies at the prompt level. Instead of me hand-writing an exhaustive, future-proof instruction set up front, I can say something closer to what I actually want:
"Run this analysis. Then, based on any hiccups you hit along the way, rewrite the instructions so that next time it runs more smoothly."
In other words, I ask the system to turn its own debugging experience into a better future prompt. It does the initial run, hits a few bumps, figures out workarounds, and then distills all of that into a reusable, improved instruction set for the next time.
This is where the "collapse of time and tools" gets a bit recursive. We are not just using tools to move data. We are using tools to improve the way we talk to the tools. The sacred scrolls are still being written, but now some of them are authored by the system itself, with us editing rather than drafting from scratch.
What actually changes for analysts
Whenever someone says "automation" in analytics, it tends to trigger one of two reactions:
- "Great, I never have to write SQL again."
- "Terrible, the robots are coming for my job."
Reality, as usual, is less dramatic and more nuanced.
If you spend your entire day hand-writing brittle, bespoke pipelines that no one else understands, parts of that work will be absorbed by systems that can observe their own failures and generate better versions.
But the demand for good questions, sensible metrics, and nuanced interpretation is not going away. If anything, the volume of "answers" is about to explode, and someone still has to decide which of them are both correct and useful.
In practice, the role starts to look more like:
- Framing problems in language a system can work with.
- Inspecting and refining the pipelines it generates.
- Spot-checking results against domain knowledge and edge cases.
- Spending more time on communicating what the analysis means and less on persuading a warehouse or CSV to cooperate.
You still need to understand enough about how the data is shaped to detect when the magic has gone wrong. You still need the instincts that come from years of seeing datasets misbehave. The difference is that you are no longer paid primarily for your ability to remember which dialect of SQL uses which flavor of quotation mark.
A quiet upgrade, or a revolution?
I don't think of this as "the end of analytics as we know it." It feels more like a substantial and disruptive upgrade to the default workflow.
We used to accept that if you wanted to do serious analysis, you had to invest heavily in hand-built plumbing. That was simply the entry fee. Now, the tools are starting to absorb more of that cost, and they are doing it in a way that keeps you in the same conversational space from question to answer.
That collapse of time and tools is not just a convenience. It changes who can participate in data work, how quickly organizations can iterate, and what analysts actually spend their attention on. It takes the sacredness out of the scrolls and puts it back into the questions.
And personally, I am fine with celebrating that. Even if it makes me shed a silent tear whenever I think of the ALL the time I have spent in my 20+ years hand-wiring the SQL plumbing, writing stored procedures, optimizing scripts. I'll save another silent tear for the day my child ask me "what, you used to write code by hand?!"